
Intelligence · Phase 3
Forecasting
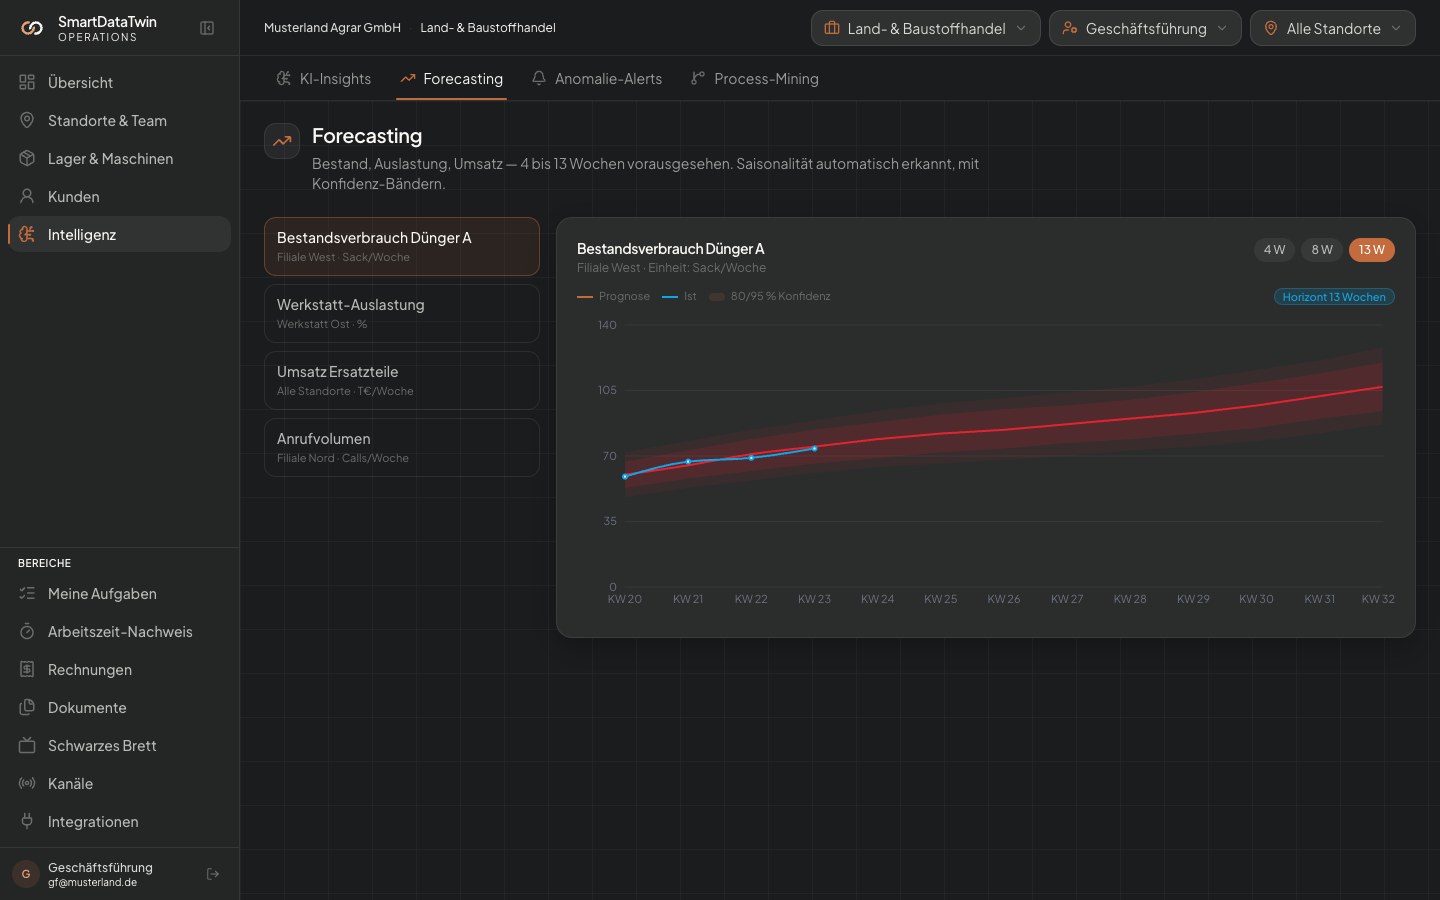
Stock, utilisation, revenue — projected 4 to 13 weeks ahead. Forecasting-Pipeline on your event log. Seasonality auto-detected.
What it does
01
Multi-horizon
4 / 8 / 13 weeks. Per item × site, per workshop utilisation, per customer cluster.
02
Auto seasonality
Prophet picks up weekly, monthly, yearly patterns without manual tuning.
03
Confidence intervals
Every forecast with 80 %/95 % band. You know how sure the AI is.
How it runs
- 01
Feature store
Materialised views on the event log. Daily refresh.
- 02
Forecast job
Weekly + on-demand. Specialised models per data series, ensemble for complex patterns.
- 03
Recommendation
Imminent stock-out → task. Utilisation spike → staffing suggestion.
What you get
- Stock forecast per item × site × 4 weeks
- "For May, current trend implies +12 % workshop utilisation."
- Season heatmap per industry
Requires
- → Inventory + AI baseline layer.
In the example
4–13 w
forecast horizon
80/95 %
confidence bands